
Or shall we expect more of the same from second half of 2022?
Twice in recent weeks it happened that a home’s price was significantly reduced and buyers went in to a frenzy trying to buy those homes. One of those homes received 53 offers! And some people are wondering if the market has changed . In light of widespread concern of economic downturn, we all are curious to know which direction the market takes in the new year. So, let’s find out if January numbers tell us anything.
Figures 1 and 2 compare December-2022 and January-2023 single family home data for Fremont and Pleasanton, respectively. The calculations include single family homes 1200 to 2500 sq ft in size that sold or went pending in these months. These two cities are chosen for analysis because Pleasanton and Fremont are two of the popular destinations among homebuyers and make for good examples to study change in market direction. (Average days on market number may change especially for January as more closings coming in and lets discount them for now.)
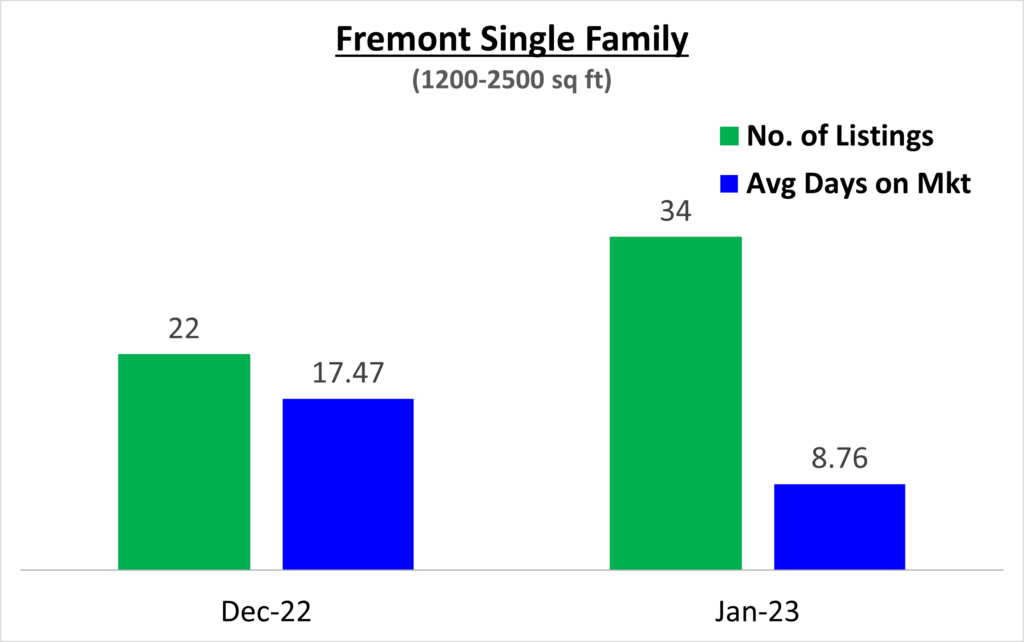
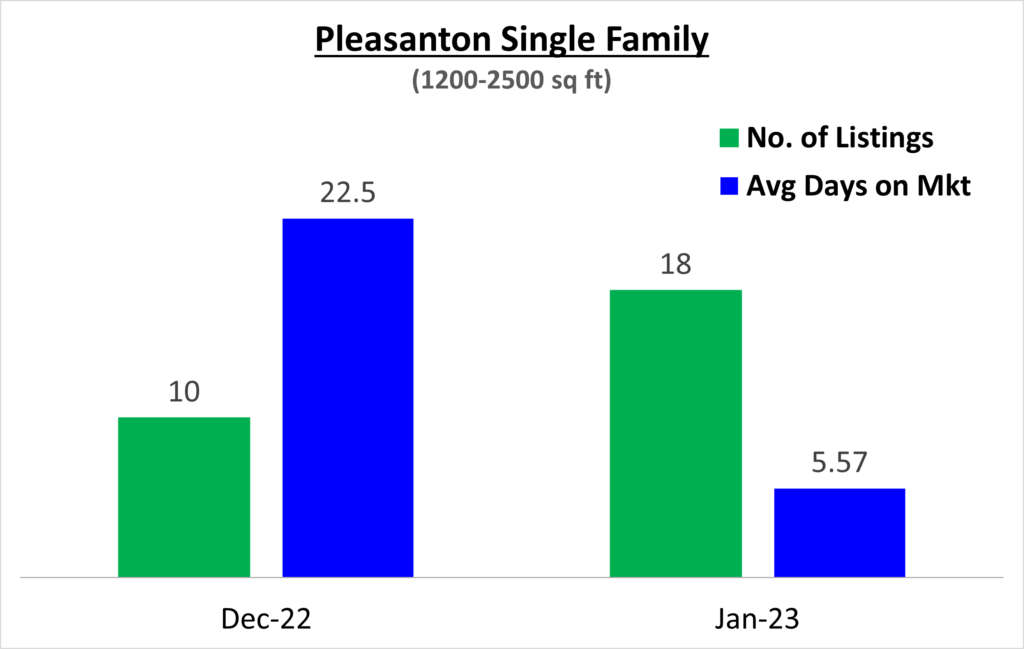
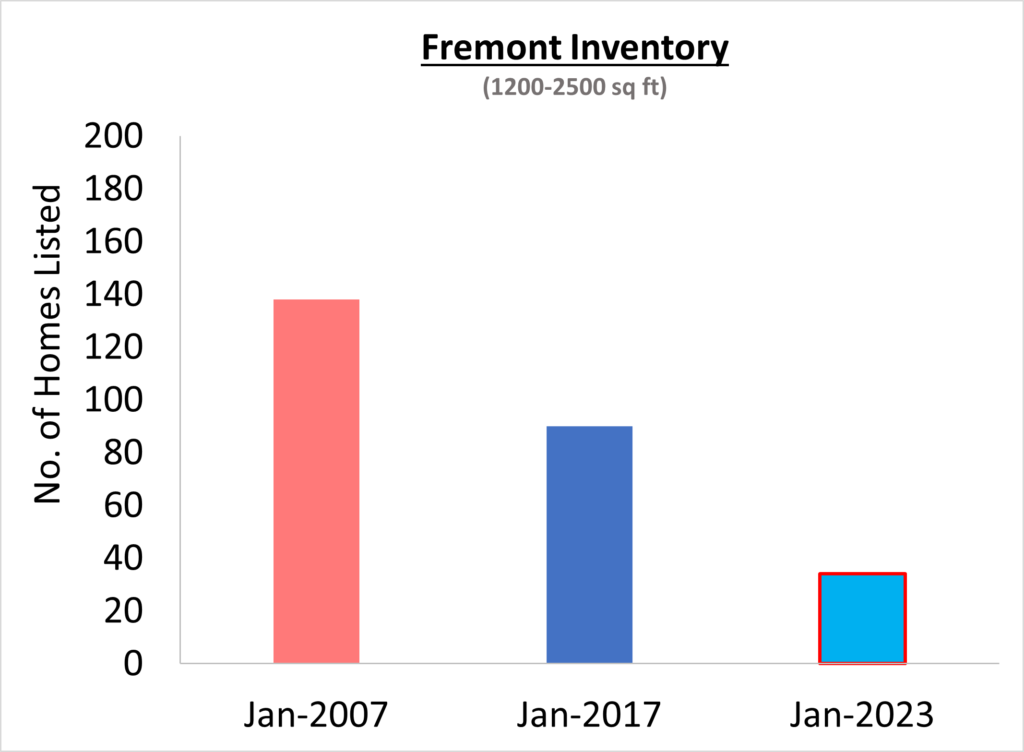
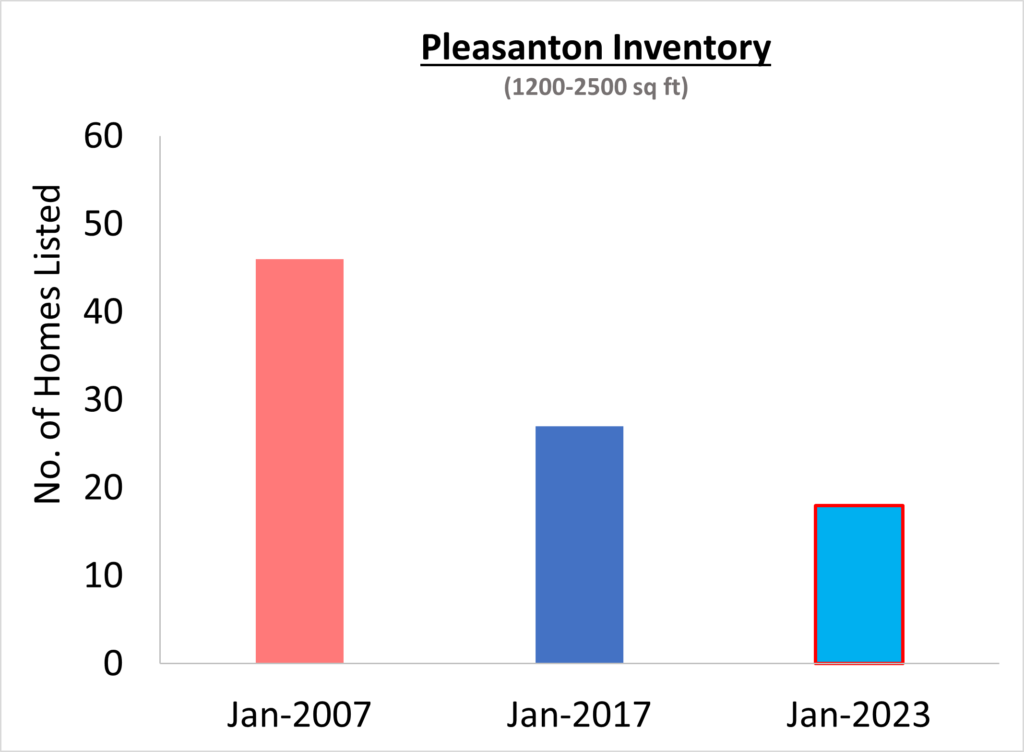
Both these markets showed positive trend as the inventory unticked. But has the market changed significantly? To conclude anything on this, we need to compare these numbers to historical data. I had discussed in another post that the inventories are at historical low. And they had not changed significantly till December 2022. As shown in Figures 3 and 4, the inventories for Fremont and Pleasanton markets are still significantly lower than those in 2007. This was a time when market was rapidly dropping due to subprime mortgage crisis. If we go to a quieter period such as 2017, the inventories were still significantly higher than today. It is very difficult to judge market direction when so few homes are coming in the market right now.
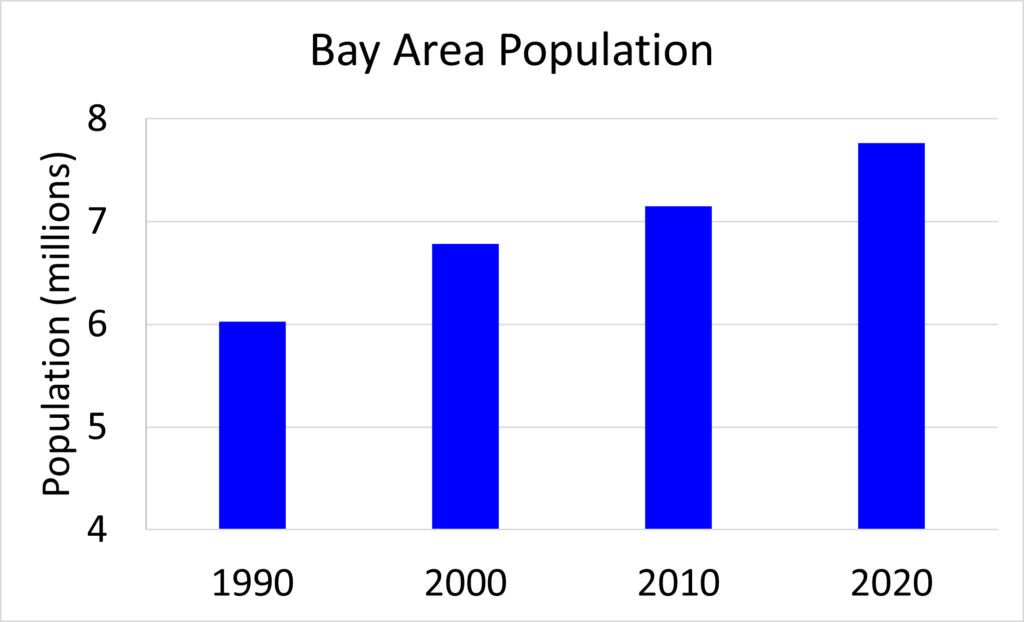
A big question is whether there will be a catastrophic failure? Bay Area population has steadily increased for past several decades as shown in Figure 5. New home builders have been far behind the required number of units to keep pace with population size. And there are plenty of buyers waiting on the side lines. These factors may keep the real estate market from catastrophic failure but we are yet to see the impact on market consistent with these factors.
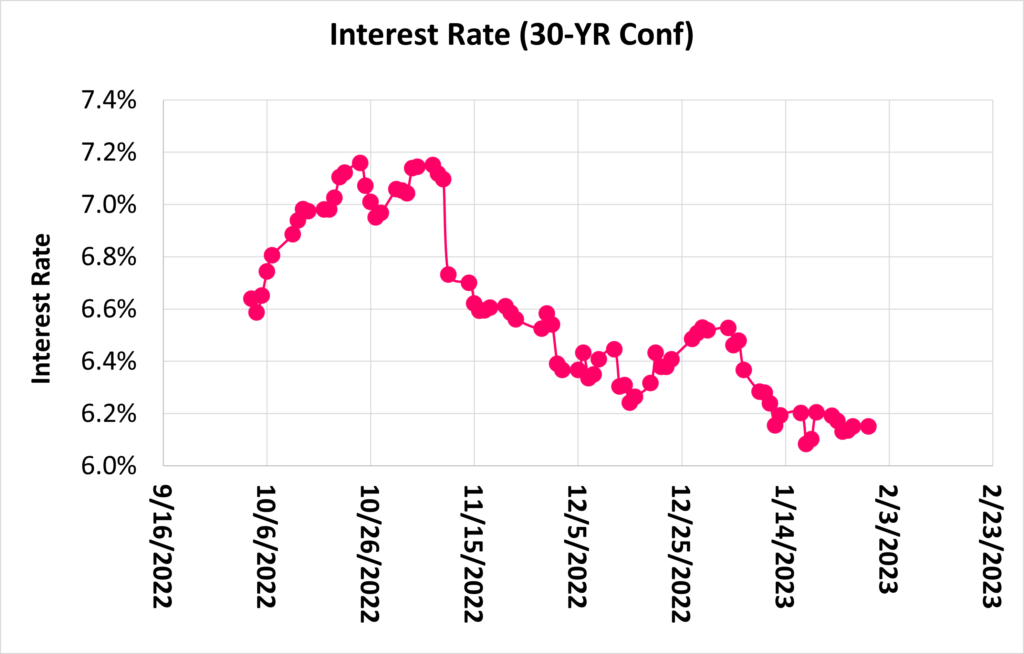
Home prices have been softening since July last year. And its possible that this market is presenting buyers opportunity to buy homes. Many buyers are waiting for a few years as prices skyrocketed. And if the market does not soften further then they may want to take the advantage of this market. This has been boosted further by lower interest rates for past few weeks as shown in Figure 7. And this may explain sudden buying frenzy on some homes after substantial price reduction.
We definitely need to see more data to get clarity on market direction. As always, I am closely watching the market and will keep bringing my insights to you. If you have been waiting or thinking about getting in market then lets connect. I am happy to discuss and help you navigate this real estate market! And yes, send me your comments, questions, and suggestions in the comments section below.


Great Article SP.
Thanks! We will have a more and more data driven analyses published moving forward to help our viewers.